Note
Go to the end to download the full example code
Source spectra#
Calculate the source spectra.
import matplotlib.pyplot as plt
import numpy as np
from singletscalar_dm import *
You can use the function DMspectra_inttable to calculate the source spectrum. The example below calculates the spectrum for gamma rays with smoothing.
mS = 200 # GeV
lambda_hs = 0.01
log10x,dNdlog10x = DMspectra_inttable(mS,lambda_hs,'gammas',True)
print(log10x,dNdlog10x)
[-8.955 -8.865 -8.775 -8.685 -8.595 -8.505 -8.415 -8.325 -8.235 -8.145
 -8.055 -7.965 -7.875 -7.785 -7.695 -7.605 -7.515 -7.425 -7.335 -7.245
 -7.155 -7.065 -6.975 -6.885 -6.795 -6.705 -6.615 -6.525 -6.435 -6.345
 -6.255 -6.165 -6.075 -5.985 -5.895 -5.805 -5.715 -5.625 -5.535 -5.445
 -5.355 -5.265 -5.175 -5.085 -4.995 -4.905 -4.815 -4.725 -4.635 -4.545
 -4.455 -4.365 -4.275 -4.185 -4.095 -4.005 -3.915 -3.825 -3.735 -3.645
 -3.555 -3.465 -3.375 -3.285 -3.195 -3.105 -3.015 -2.925 -2.835 -2.745
 -2.655 -2.565 -2.475 -2.385 -2.295 -2.205 -2.115 -2.025 -1.935 -1.845
 -1.755 -1.665 -1.575 -1.485 -1.395 -1.305 -1.215 -1.125 -1.035 -0.945
 -0.855 -0.765 -0.675 -0.585 -0.495 -0.405 -0.315 -0.225 -0.135 -0.045] [2.499485e-02 2.486417e-02 2.486236e-02 2.511304e-02 2.525963e-02
 2.523032e-02 2.537887e-02 2.550804e-02 2.557923e-02 2.586439e-02
 2.609542e-02 2.611656e-02 2.619649e-02 2.661558e-02 2.714063e-02
 2.743451e-02 2.776405e-02 2.814987e-02 2.855244e-02 2.916711e-02
 2.996515e-02 3.048045e-02 3.063928e-02 3.114683e-02 3.200282e-02
 3.282581e-02 3.364372e-02 3.435156e-02 3.489256e-02 3.568184e-02
 3.655276e-02 3.735820e-02 3.838768e-02 3.957577e-02 4.095348e-02
 4.262049e-02 4.409824e-02 4.537513e-02 4.698486e-02 4.847704e-02
 4.967969e-02 5.096678e-02 5.260000e-02 5.876700e-02 6.445600e-02
 7.490000e-02 9.017800e-02 1.145800e-01 1.482400e-01 1.975000e-01
 2.669900e-01 3.662800e-01 4.954200e-01 6.791800e-01 9.175600e-01
 1.232200e+00 1.621300e+00 2.115500e+00 2.739300e+00 3.487200e+00
 4.359800e+00 5.417900e+00 6.583500e+00 7.915100e+00 9.370300e+00
 1.093600e+01 1.254200e+01 1.419700e+01 1.582000e+01 1.734000e+01
 1.865200e+01 1.979800e+01 2.060300e+01 2.107600e+01 2.119200e+01
 2.088400e+01 2.018200e+01 1.911900e+01 1.783100e+01 1.625300e+01
 1.462400e+01 1.288300e+01 1.108700e+01 9.357900e+00 7.722700e+00
 6.223400e+00 4.882900e+00 3.721700e+00 2.753800e+00 1.960400e+00
 1.336200e+00 8.702300e-01 5.338600e-01 3.058900e-01 1.668400e-01
 8.473300e-02 3.942200e-02 1.903300e-02 8.833300e-03 6.666700e-04]
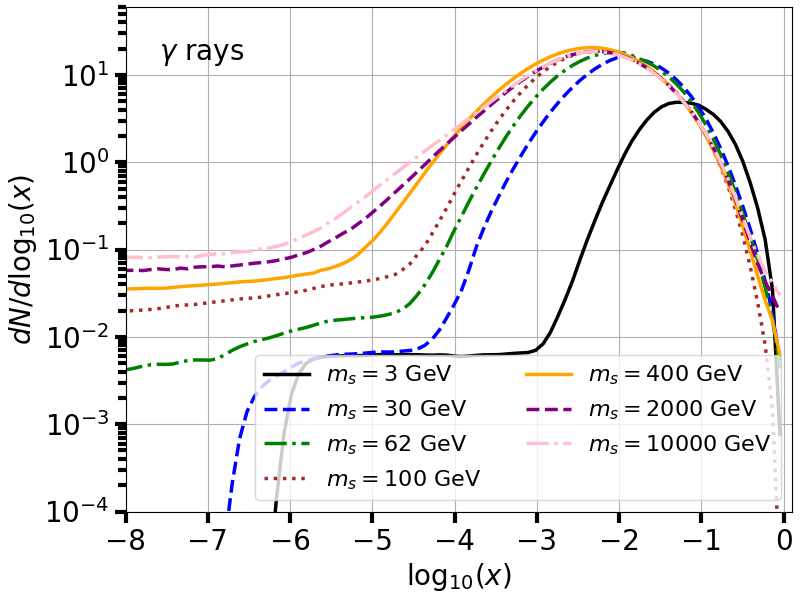
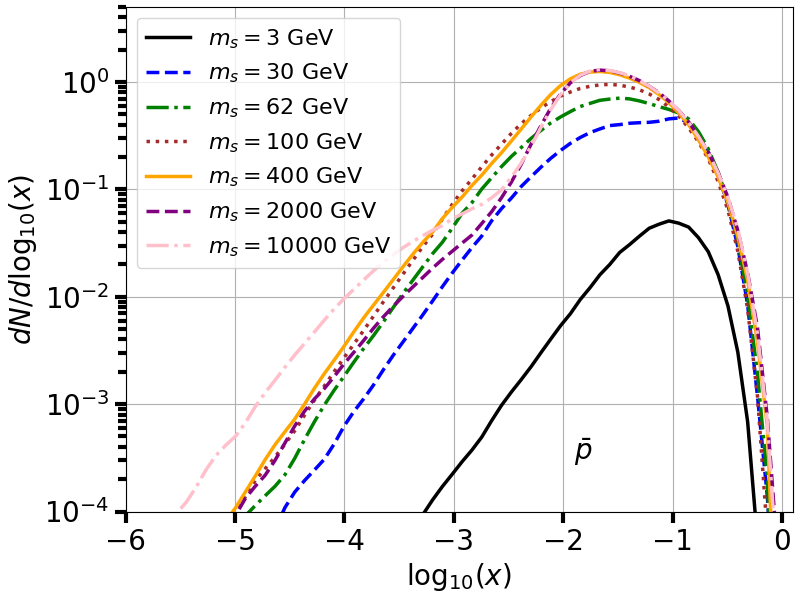
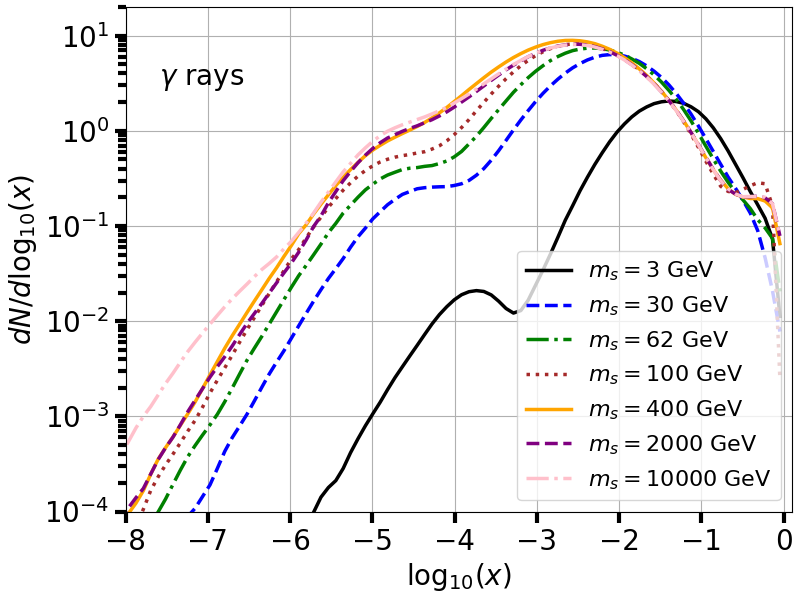
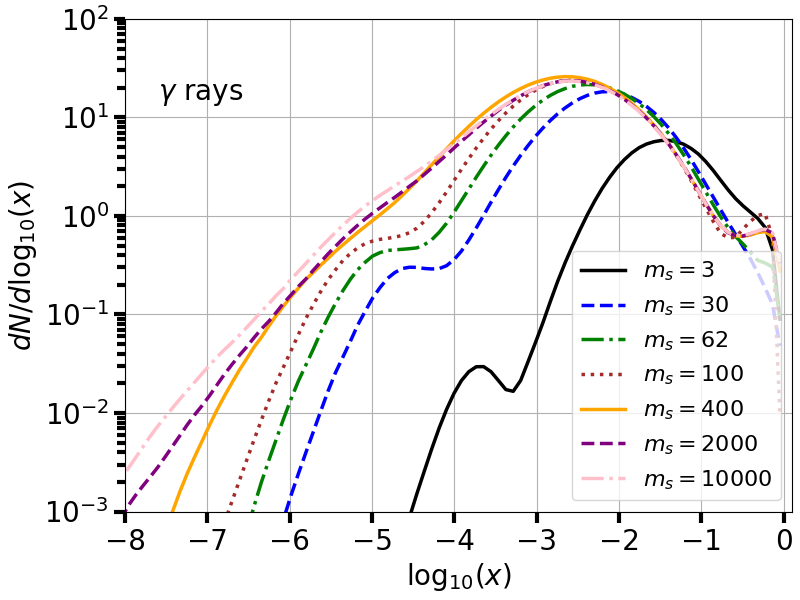
The following examples, instead, show the source spectra for gamma rays, positrons, antiprotons and neutrinos.
mass_vec = np.array([3.,30.0,62.,100,400.,2000,10000])
colors_vec = np.array(['black','blue','green','brown','orange','purple','pink'])
ls_vec = np.array(['-','--','-.',':','-','--','-.',':','-'])
fig = plt.figure(figsize=(8,6))

for t in range(len(mass_vec)):
    x_vec,dNdlogx = DMspectra_inttable(mass_vec[t],0.1,'gammas',True)
    plt.plot(x_vec,dNdlogx,lw=2.5,ls=ls_vec[t],color=colors_vec[t],label=r'$m_s=%d$ GeV'%mass_vec[t])

plt.xlabel(r'$\log_{10}(x)$', fontsize=20)
plt.ylabel(r'$dN/d\log_{10}(x)$', fontsize=20)
plt.text(-7.6,15,r'$\gamma$ rays', fontsize=20)
plt.axis([-8,0.1,1e-4,6e1])
plt.xticks(fontsize=20)
plt.yticks(fontsize=20)
plt.tick_params('both', length=8, width=3, which='major')
plt.tick_params('both', length=6, width=3, which='minor')
plt.grid(True)
plt.yscale('log')
plt.xscale('linear')
plt.legend(loc=4,prop={'size':16},numpoints=1, scatterpoints=1, ncol=2)
fig.tight_layout(pad=0.5)
plt.show()

fig = plt.figure(figsize=(8,6))

for t in range(len(mass_vec)):
    x_vec,dNdlogx = DMspectra_inttable(mass_vec[t],0.1,'antiprotons',True)
    plt.plot(x_vec,dNdlogx,lw=2.5,ls=ls_vec[t],color=colors_vec[t],label=r'$m_s=%d$ GeV'%mass_vec[t])

plt.xlabel(r'$\log_{10}(x)$', fontsize=20)
plt.ylabel(r'$dN/d\log_{10}(x)$', fontsize=20)
plt.text(-1.9,3e-4,r'$\bar{p}$', fontsize=20)
plt.axis([-6,0.1,1e-4,5e0])
plt.xticks(fontsize=20)
plt.yticks(fontsize=20)
plt.tick_params('both', length=8, width=3, which='major')
plt.tick_params('both', length=6, width=3, which='minor')
plt.grid(True)
plt.yscale('log')
plt.xscale('linear')
plt.legend(loc=2,prop={'size':16},numpoints=1, scatterpoints=1, ncol=1)
fig.tight_layout(pad=0.5)
plt.show()

fig = plt.figure(figsize=(8,6))

for t in range(len(mass_vec)):
    x_vec,dNdlogx = DMspectra_inttable(mass_vec[t],0.1,'positrons',True)
    plt.plot(x_vec,dNdlogx,lw=2.5,ls=ls_vec[t],color=colors_vec[t],label=r'$m_s=%d$ GeV'%mass_vec[t])

plt.xlabel(r'$\log_{10}(x)$', fontsize=20)
plt.ylabel(r'$dN/d\log_{10}(x)$', fontsize=20)
plt.text(-7.6,3,r'$\gamma$ rays', fontsize=20)
plt.axis([-8,0.1,1e-4,2e1])
plt.xticks(fontsize=20)
plt.yticks(fontsize=20)
plt.tick_params('both', length=8, width=3, which='major')
plt.tick_params('both', length=6, width=3, which='minor')
plt.grid(True)
plt.yscale('log')
plt.xscale('linear')
plt.legend(loc=4,prop={'size':16},numpoints=1, scatterpoints=1, ncol=1)
fig.tight_layout(pad=0.5)
plt.show()

fig = plt.figure(figsize=(8,6))

for t in range(len(mass_vec)):
    x_vec,dNdlogx_ne = DMspectra_inttable(mass_vec[t],0.1,'neutrinos_e',True)
    x_vec,dNdlogx_nmu = DMspectra_inttable(mass_vec[t],0.1,'neutrinos_mu',True)
    x_vec,dNdlogx_ntau = DMspectra_inttable(mass_vec[t],0.1,'neutrinos_tau',True)
    plt.plot(x_vec,dNdlogx_ne+dNdlogx_nmu+dNdlogx_ntau,lw=2.5,ls=ls_vec[t],color=colors_vec[t],label=r'$m_s=%d$'%mass_vec[t])

plt.xlabel(r'$\log_{10}(x)$', fontsize=20)
plt.ylabel(r'$dN/d\log_{10}(x)$', fontsize=20)
plt.text(-7.6,15,r'$\gamma$ rays', fontsize=20)
plt.axis([-8,0.1,1e-3,1e2])
plt.xticks(fontsize=20)
plt.yticks(fontsize=20)
plt.tick_params('both', length=8, width=3, which='major')
plt.tick_params('both', length=6, width=3, which='minor')
plt.grid(True)
plt.yscale('log')
plt.xscale('linear')
plt.legend(loc=4,prop={'size':16},numpoints=1, scatterpoints=1, ncol=1)
fig.tight_layout(pad=0.5)
plt.show()

Total running time of the script: ( 0 minutes 14.183 seconds)